Continuing the saga, we now shall discuss fractionation and SDS-PAGE! Again, all of this information may be found on the OWL-SPACE and OWLNET sites for this course.
Fractionation
I hate blood. I really do. Most of the time I’m okay with it, but I occasionally have bad days where I just really, really cannot stand the sight of blood. I refer you to Angels in America, specifically the scene where Al Pacino yanked his IV out of his arm and then would NOT stop bleeding all over everything. Meanwhile, I had to go donate blood that week. How do you think that went?
Anyways, if you don’t like blood I suggest you skip right the heck over this part because fractionation is all about blood, more precisely, separating blood into its composite parts. In lab we used horse blood, but I guess any old sort of blood will work too.
Blood is easy to fractionate because it consists of two main parts: cells and plasma. Basically you start with 2-3 mL of whole blood in a centrifugation tube and dilute it with several times that of isotonic solution. Then you centrifuge it for a short period of time (~10 min) at low speed to separate the dilute plasma from the blood cells. Pipette some of that straw-colored stuff and save it. That’s fraction #1.
Then resuspend the pellet and centrifuge it to wash off any excess plasma . You’ll be left with a tiny blob of red stuff, which you need to resuspend in hypotonic solution to pump liquid into the cells and make them burst. Life is cruel. Centrifuge that blood again and reserve some of the darkish reddish liquid up top, which is lysate. Fraction #2. After some more centrufigation, the material in the tube will have separated into two parts – take a sample of the top part. This is cytosol (fraction #3, intracellular fluid, heck of a lot of protein.)
The pinkish stuff that now appears near the bottom of the tube is cell membrane. Your goal is to make it as white as possible. Pipette off all the remaining cytosol. Wash it. Wash it many times. Awesome; that’s fraction #4. You’re done!
Well, not quite yet, because first you need to conduct a protein assay, which is a lot less painful than it sounds!
The assay used in this lab was a Bradford assay, developed by the (in)famous Marion Bradley, who was also, contrary to my earlier beliefs, a dude. The Bradford assay is sensitive to about 5-200 micrograms protein, and is based off the observation that Coomassie Blue (named after, in case anyone cares, Kumasi, Ghana) changes absorbance values when binding to protein, and also produces a visible color change. In order to perform such an assay, one needs several standards (solutions containing known amounts of protein, for this lab being protein from bovine serum albumin – cow blood, basically) to measure the absorbance values of. Then you are able to plot a curve relating protein concentration to absorbance value. Diluting each of your samples based on their estimated range of protein concentration, you are then able to record their absorbance values and perform a regression based on your standard curve.
(If this doesn’t make any sense to you, don’t worry. Someone is basically using this lobby as their own personal room, complete with widescreen TV to watch sports on and a nice piano with which to practice incredibly repetitive songs.)
SDS-Page
SDS-page is horrendously complex. Or rather, it isn’t that complex, but it’s hard to write about and be interested in for very long. So I’ll try to make this section short.
There is no need to go into the biochemistry/p-chem behind the way SDS-PAGE works. You can find more of that on Caprette’s old website, if you’re interested. The basic setup is this: you have an acrylamide gel, you add your blood fractions from above, denatured of course, and stained with a little bromophenol blue dye, you plug the whole thing into an electrical circuit, and the electricity drives the protein molecules down the gel. The heavier molecules of course don’t go as far as the lighter ones.
Usually, on one or the other side of the gel, you will “run” either a high or low molecular-weight standard set. The high molecular weight is used in the low-density gels (7% acrylamide) and the low molecular weight is used in the high density gels (15% acrylamide.) This makes sense if you think about it – high-MW proteins may not even penetrate into a high density gel, and low-MW proteins might run completely off a low-density gel! You know the molecular weight of these standards, so as before you can construct a standard curve relating the migration distance of each protein to the log of its mass, and conduct a regression from that curve to estimate the molecular weights of the proteins you are interested in.
For le reference, this is what a completed SDS-PAGE gel looks like:

Those heavy bands represent a high concentration of that particular protein, and the lighter bands represent a relative paucity of protein (I enjoy large words in my mouth.) If two bands are squished close together, they may represent two different isomers of the same protein. To make matters worse, many proteins have very similar molecular weights, meaning that one band may represent two or more proteins! No wonder some of those bands are so dark!
Because of all these complications, one can’t decisively identify the proteins in a sample just by looking at a gel, no matter how good it may look. Analysis of the same gel may even differ from person to person! That’s why it’s very important to always refer to the results of such an SDS-PAGE run as “apparent molecular weights.”
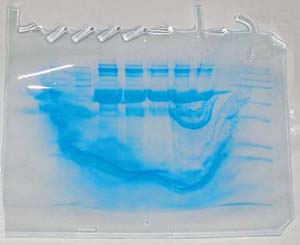
Here’s another very important thing to do: KEEP THE LID CLOSED WHILE THE GEL IS RUNNING! Otherwise you end up with something like the above, which is of course unusable. I’m just happy opening the lid didn’t result in anything worse in this case. (Death. I’m talking about death.)